Making Various Charts in Excel
You can make any type of chart you
choose using Excel. Most computers have the Excel program installed. The Excel
icon looks like this:![]()
- You need to label your vertical (& horizontal, in some cases) columns.
- Type in ‘values’ in the column (I sequenced my patient needs from 4-1).
- Move your cursor over the columns while pressing the left mouse button (ie. highlight the columns).
Note: this is only an example.
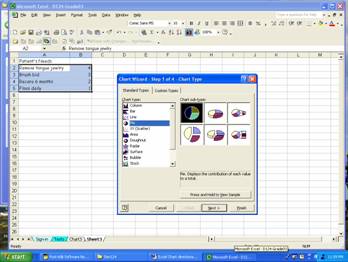
- select chart type (this shows “pie”)
- don’t change any numbers in step 2
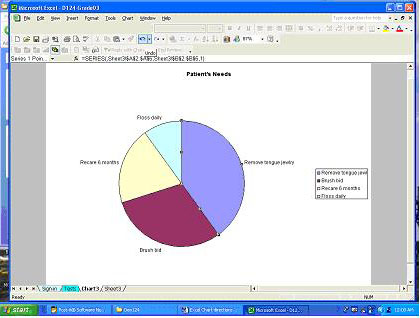
- create a title (it will appear in the middle of your page)
- chart location – choose “as new sheet”
When the pie chart appears, click on any segment of the chart. A menu box will appear. Check “category name”. This will make your labels appear.
Return to
WebQuest homepage Format Jim Ann Evaluation